Avoid False Breakouts: How to Identify FX Wedge Patterns and 3 Winning Setups
 2026-03-19
“Ah… I got caught by a wedge again…”
Even after trading forex for more than a year, when a wedge pattern appears on the chart you may think, “This time it will work!” and enter a trade—only to end up losing again. Have you ever had this experience?
Books and videos often say things like “Wedges are a reliable pattern!” or “If you learn this formation, you can win.” But in real trading, traders often get caught in false breakouts and end up hitting stop-losses repeatedly. You may start wondering, “Is it really okay to enter based on this pattern?” or “How can I spot a false breakout?”
This article is written for those who feel, “I understand the theory, but when it comes to real trading, things don’t go as expected.” Rather than focusing on theory alone, this guide emphasizes practical insights that can actually be applied in real trading.
Along with the basic structure of wedge patterns, we will cover three key points to check before entering a trade to help avoid false breakouts, as well as how to distinguish wedges from other chart patterns. With real chart examples, easy-to-compare tables, and a checklist for times when you are unsure, this guide brings together the essential information you need to analyze wedge patterns with confidence.
Once you clearly understand what to look for and how to make your judgment, wedge patterns will no longer be confusing. By reading this article, you can take the first step toward leaving common losing setups behind and building greater confidence in your forex trading.
What Is an FX Wedge? — Basic Definition and Key Characteristics

What Kind of Chart Pattern Is a Wedge?
In forex trading, a “wedge” refers to a wedge-shaped chart pattern where price highs and lows gradually converge. It often appears near the end of a trend or around potential market turning points. After the market moves strongly in one direction, price fluctuations gradually become smaller, and the upper and lower trend lines begin to converge diagonally.
The Difference Between Rising Wedges and Falling Wedges
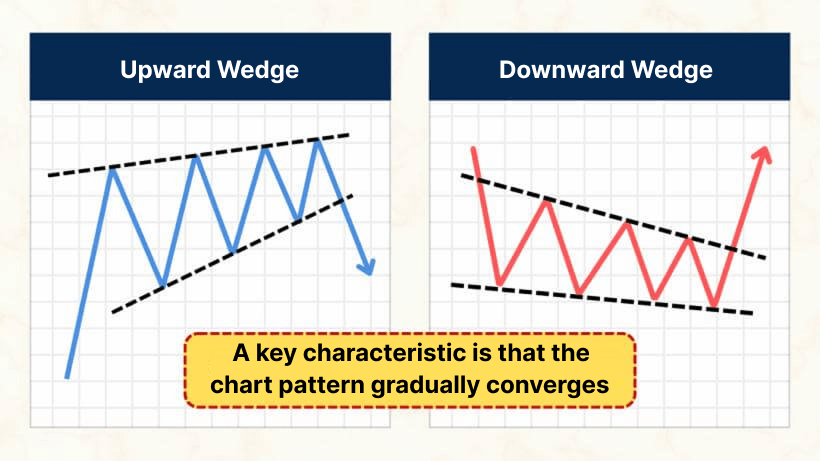
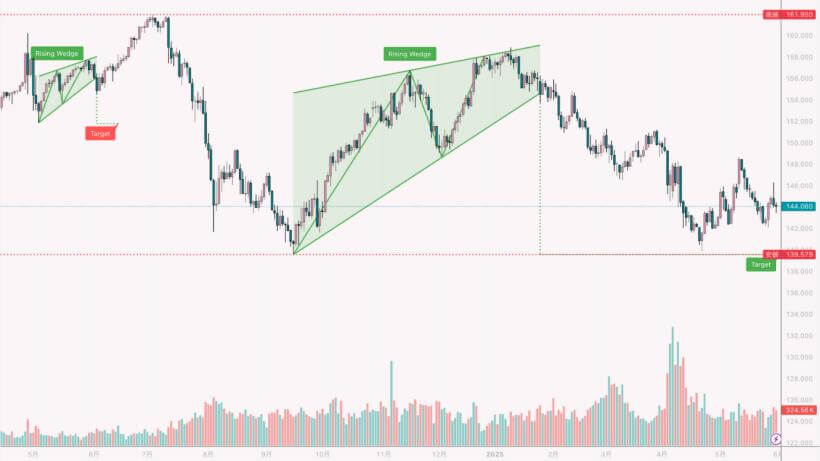
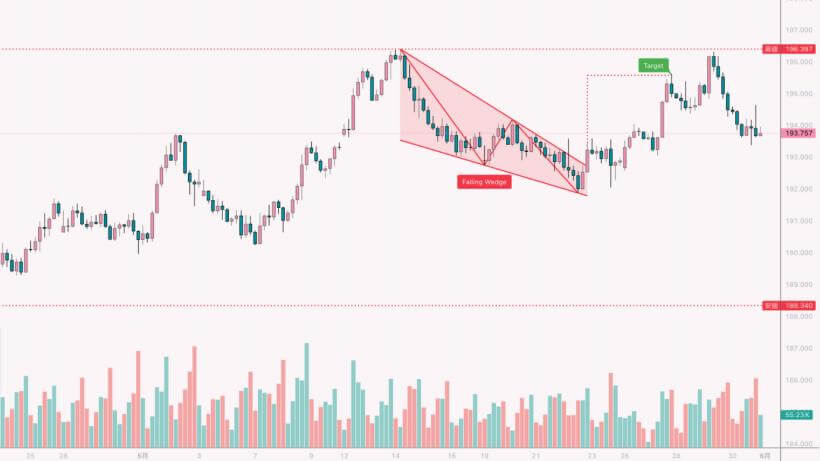
There are two main types of wedge patterns. A Rising Wedge forms as both highs and lows move upward, gradually pushing the price higher, but it often leads to a breakout to the downside, signaling a potential bearish reversal. In contrast, a Falling Wedge develops as both highs and lows move downward. Despite the downward movement, it often results in an upward breakout, making it a pattern that can signal a bullish reversal.
Market Psychology and the Core Meaning Behind Wedge Patterns
Wedge patterns are often introduced as signals of trend reversals, but they do not always indicate a reversal. In some cases, they appear as a temporary consolidation within an existing trend. The key characteristic is that price movements gradually narrow, building pressure before eventually breaking out in a strong move. In forex markets, wedges are commonly seen on higher timeframes such as the 1-hour and 4-hour charts. For swing traders and day traders, they can serve as an important signal for anticipating the next significant market move.
Learn from Real Charts: How to Identify Wedge Patterns and Common Mistakes

Tips for Identifying Wedges on Real Charts
In theory, wedge patterns may look simple, but correctly identifying them on real charts is often more difficult than it seems. Traders frequently struggle with where to draw the trend lines, and the pattern is often confused with similar formations such as triangles or flags. This uncertainty is one of the main reasons many traders hesitate to enter a trade with confidence.
Wedge Pattern Mistake Checklist
| Item | Correct Example | Incorrect Example |
|---|---|---|
| Line Convergence | Lines converge diagonally | Horizontal or unclear |
| Wave Rhythm | Amplitude gradually decreases | Irregular price swings |
| Movement After Breakout | Volume increases with clear candlesticks | No volume change, many long wicks |
| Identification Accuracy | Consistent with the trend | Confused with other patterns |
Why Do Traders Misidentify Wedge Patterns?
Even when a formation looks like a wedge, entering a trade before the pattern fully meets these conditions often leads to false breakouts. Instead of judging based on the visual shape alone, it is important to evaluate the pattern from multiple perspectives to confirm whether the wedge formation is truly complete.
Three Steps to Avoid False Breakouts (With a Practical Flowchart)
Step 1: Check Changes in Volume
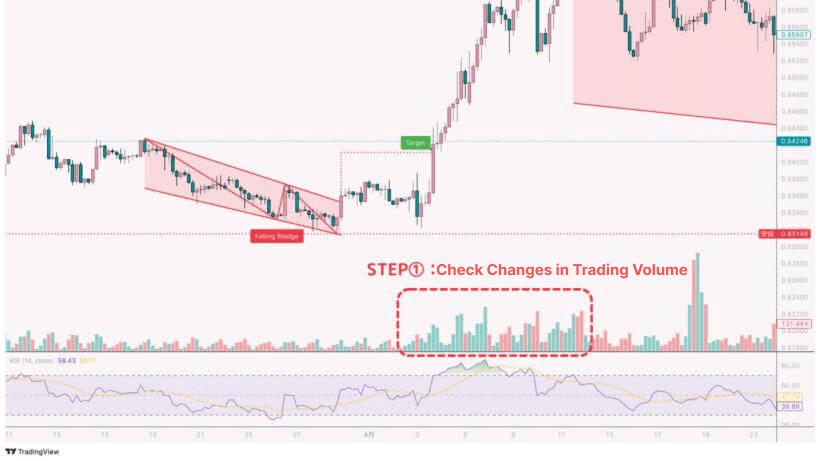
One of the most important factors in identifying a genuine breakout is whether trading volume increases sharply just before or immediately after the breakout. When more market participants enter the market and trading momentum rises rapidly, it becomes more likely that the move represents a real breakout rather than a false signal.
Step 2: Watch for Candlestick Reversal Signals
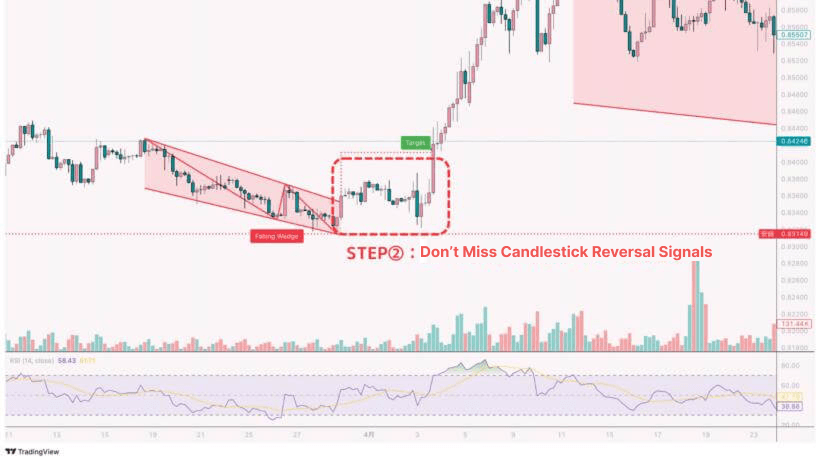
Near the breakout point, check whether large-bodied candlesticks or clear bullish or bearish candles with minimal wicks appear. In contrast, if you see small candles with long wicks or erratic price movement in both directions, the reliability of the breakout may be weaker.
Step 3: Identify Divergence with RSI or MACD
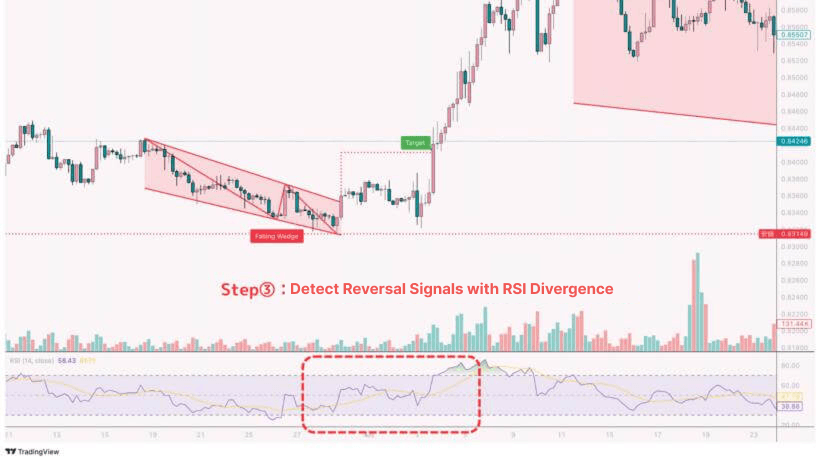
Divergence in indicators such as RSI or MACD can be an effective signal of a potential trend reversal. If the price continues to form higher highs or lower lows while the RSI begins to move in the opposite direction, it may indicate weakening momentum and a possible shift in the trend.
Practical Flowchart: Enter Only When All Three Signals Align
| Checklist | YES | NO |
|---|---|---|
| Trading volume increases sharply | ||
| Breakout occurs with a large-bodied candlestick | ||
| RSI or MACD divergence is present |
Follow the Rule: Enter Only When All Conditions Are Met
Simply following the rule of entering a trade only when all conditions are met can significantly reduce false breakouts. Having the discipline to wait for the right setup is one of the keys to achieving consistent trading results.
Comparing Wedges with Similar Patterns (Triangles, Flags, etc.)

Understand the Differences Between Patterns at a Glance
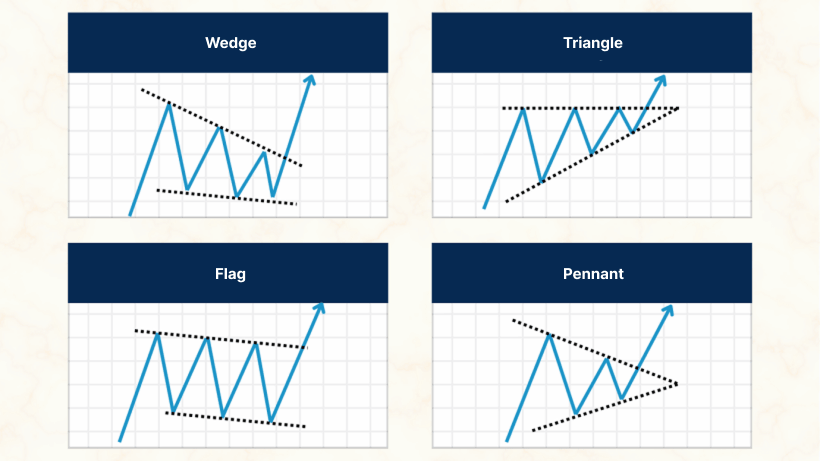
In forex trading, several chart patterns have shapes similar to wedges. In particular, patterns such as triangles, flags, and pennants often look alike, making them easy for beginners to confuse. Here, we clearly organize the differences between these patterns using comparison tables and chart illustrations.
Chart Pattern Comparison Table
| Pattern Name | Shape Characteristics | Relationship to Trend | Breakout Behavior |
|---|---|---|---|
| Wedge | Diagonal converging wedge shape | Both reversal and consolidation | False breakouts possible / requires careful judgment |
| Triangle | Horizontal or symmetrical triangle | Often a continuation pattern | Trend-following after breakout |
| Flag | Parallel channel shape | Temporary consolidation within a trend | Often continues in the direction of the trend |
| Pennant | Small triangular shape | Primarily a continuation pattern | Often breaks out in the direction of the trend |
Key Points for Identifying the Patterns
-

If the converging lines slope diagonally, it is more likely a wedge; if they are closer to horizontal, it may be a triangle or pennant
-
Check whether the price range within the pattern gradually narrows
-
Timing of appearance: wedges often appear near reversals, while flags and pennants usually appear during consolidation within a trend
If You Are Unsure, Focus on Changes in Price Waves
When in doubt, check whether the size of the price swings is gradually decreasing. Since wedges represent a buildup of market pressure, the convergence of price waves is a key characteristic.
An Entry Rule & Checklist Template Even Beginners Can Follow

Replace “Instinct Trading” with Clear Rules
Many mistakes in identifying wedge patterns happen because traders react to shapes that only look similar and enter trades based on intuition. Here, we provide an entry rule & checklist template designed to improve consistency and decision-making.
By using this checklist, you can review your decisions afterward and verify whether your analysis was correct, helping prevent the same losing patterns from repeating.
Wedge Entry Checklist (Template)
| Checklist Item | YES | NO |
|---|---|---|
| Trend lines connecting highs and lows clearly converge diagonally | ||
| Price swings gradually decrease and the pattern is fully formed | ||
| Volume decreases before the breakout and increases sharply afterward | ||
| The breakout candlestick is large with minimal wicks | ||
| RSI or MACD divergence is present | ||
| Stop-loss level and take-profit target (risk–reward) are set | ||
| If confidence or confirmation is insufficient, you decide to stay out of the trade |
Usage Tips: Record and Build a Habit
This checklist can be used not only before entering a trade, but also for reviewing trades afterward.
-
Save it in Evernote or a notes app and record each trade
-
Export it as a PDF or print it and place it near your desk
-
Share your trade reviews on social media or a blog to visualize your reasoning
By building this habit, you can gradually develop your own consistent winning patterns.
Choosing Not to Enter Is Also a Strategy
Successful traders treat the decision to “skip a trade” as part of their trading plan. Having the discipline to stay out of the market can be just as important as entering a trade.
By using this template, you can train yourself to react only to high-probability trading setups.
FAQ — Overcoming Losing Patterns & What to Do Next

Summary: A Practical Roadmap to Mastering Wedge Trading Starting Tomorrow

Review the Three Core Principles of Trading Wedge Patterns
From what we have covered so far, it should be clear that understanding the shape of a wedge pattern alone is not enough to trade it successfully. Traders need to make logical decisions based on multiple confirmations and follow rules that can be applied consistently.
Here are the three key points you should keep in mind starting from your next trade.
1. Make decisions based on rules, not intuition
2. Wait until all three confirmations are present before entering
3. Improve your accuracy through consistent record-keeping and review
-

Save the checklist as a PDF or in your notes app
-
Re-evaluate your past trades to see whether the conditions were met
-
For your next trade, confirm whether all three signals are present before entering
Trade with Confidence and Clear Reasoning
By understanding and applying the concepts explained in this article, you can move beyond the fear of losing due to false breakouts and focus on trading only high-probability setups.
Feel free to revisit this guide whenever needed and make it part of your trading toolkit.
Enjoyed this article? Share it with your network!
RYOEX Official Media is an information platform created specifically for traders, offering the latest news, analysis, guides, and more. From beginners to experienced traders, we provide useful content to help you stay informed and succeed in your trading endeavors.


