Dow Theory for Beginners: Can You Trade Successfully with It Alone?
 2026-04-17

When starting FX trading, one term you’re sure to hear is the “Dow Theory.” It is considered essential for understanding trends and identifying entry points, often regarded as a cornerstone of chart analysis. However, in practice, many beginners and intermediate traders face challenges such as “I studied the theory but can’t apply it” or “I followed the signals but still got trapped by false moves.”
This article directly addresses the question, “Can you trade successfully using only Dow Theory?” while systematically explaining the foundational knowledge and practical methods that help FX beginners avoid common pitfalls. We cover trend identification through higher highs and lower lows, spotting entry points, designing stop-loss and take-profit strategies, and specific measures to avoid false signals—selecting only actionable insights that can be applied in real trading.
By the end of this article, you’ll upgrade your understanding of Dow Theory from simply “knowing it” to “being able to use it,” gaining the confidence and skills to approach the market with clarity and assurance.
Fundamentals of FX Dow Theory

What is Dow Theory in FX?
In FX trading, you often hear the phrase “ride the trend,” but how exactly should you define and identify a “trend”? The foundation for answering this question is the Dow Theory. Developed in the late 19th century by Charles Dow, founder of the Wall Street Journal, Dow Theory is a framework for understanding the essence of price movements.
Although originally designed for the stock market, its principles are universal, rooted in market psychology, making it highly applicable to FX. As the starting point of technical analysis, it is essential knowledge that beginners should grasp first.
The 6 Core Principles of Dow Theory Explained
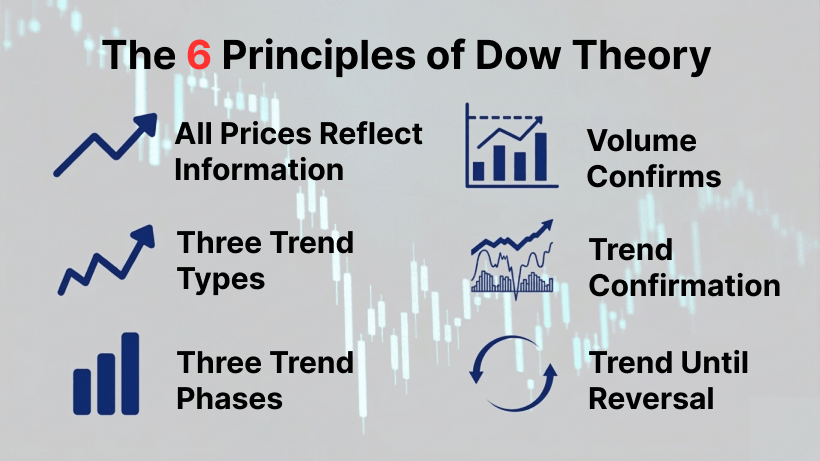
Dow Theory consists of six fundamental principles that help interpret market movements.
-
1.
All information is reflected in prices
Economic indicators, geopolitical risks, and investor sentiment are assumed to be fully incorporated into current prices.
-
2.
There are three types of trends
They are categorized as primary (long-term), secondary (medium-term), and minor (short-term) trends.
-
3.
Primary trends progress in three phases
These phases—accumulation, public participation, and distribution—represent psychological stages that are key to reading the market flow.
-
4.
Trends must be confirmed across markets
Multiple markets or indicators pointing in the same direction increase the reliability of a trend. In FX, check correlations across timeframes and currency pairs.
-
5.
Trends are confirmed by volume
While originally referring to stock market volume, in FX, tick volume is used to assess trend strength and momentum.
-
6.
Trends continue until a clear reversal signal appears
Trend-following should prevail; counter-trend trading should only occur once a definitive reversal is signaled.
Understanding these principles allows you to see chart movements not as “random waves,” but as structured patterns, enabling strategic decision-making.
The Three Phases of a Trend: Identifying Uptrends, Downtrends, and Ranges
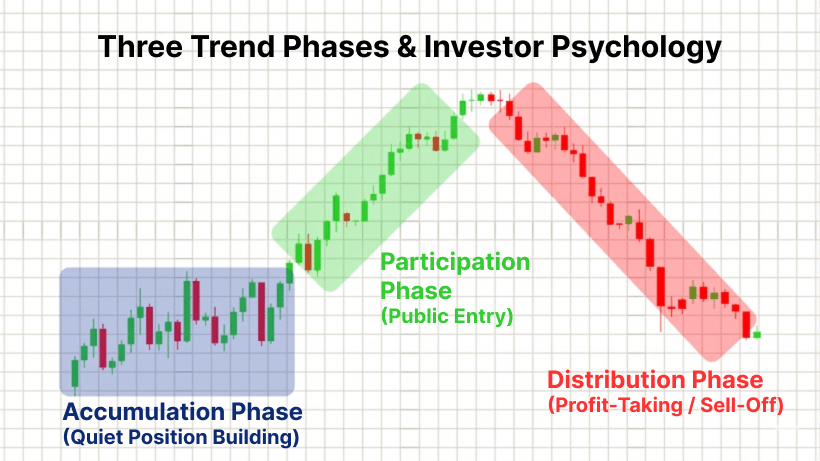
Dow Theory divides a trend into three phases: accumulation, public participation, and distribution.
-
Accumulation Phase: A stage where a few professional or large investors begin taking positions against prevailing market sentiment. In the early stage of an uptrend, buying occurs quietly.
-
Public Participation Phase: The trend becomes clear and more retail investors enter. Prices move significantly and volume increases. This is the optimal period for trend-following entries.
-
Distribution Phase: The trend approaches its end, with profit-taking and fear-driven exits. Selling pressure rises in uptrends, while panic selling can accelerate in downtrends.
Recognizing range-bound markets (“sideways” trends) is also important. In such cases, avoid forcing trend-following strategies and consider waiting or using counter-trend approaches.
This section provided a foundation for understanding Dow Theory. Next, we will dive deeper into techniques for identifying trends using “higher highs and lower lows.”
Analyzing Trends with Dow Theory Using Highs and Lows

How to Identify Uptrends and Downtrends with Dow Theory
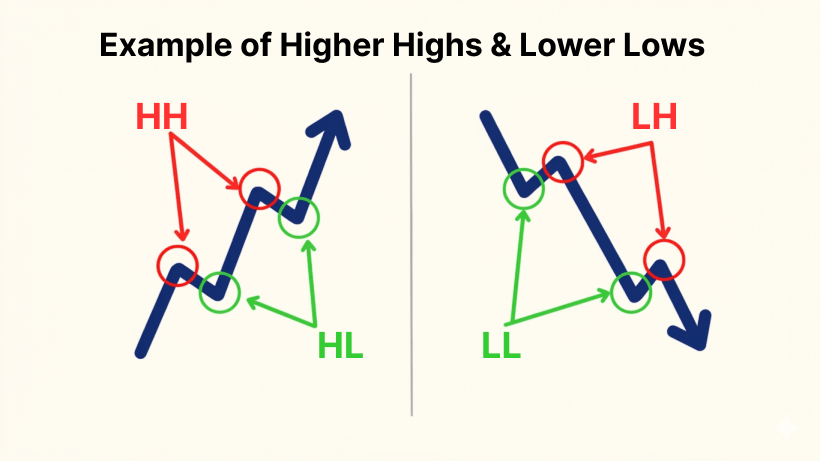
Dow Theory focuses on the movement of highs (High) and lows (Low) to determine trend direction. The basic patterns are as follows:
-
Uptrend: Both highs and lows are rising
(a continuous series of Higher Highs [HH] and Higher Lows [HL]) -
Downtrend: Both highs and lows are falling
(a continuous series of Lower Highs [LH] and Lower Lows [LL])
This “wave continuity” reflects the essence of a trend. When these movements are visible on a chart, traders typically align their entry strategies with the trend direction.
Key Points for Spotting Trend Reversals with Dow Theory
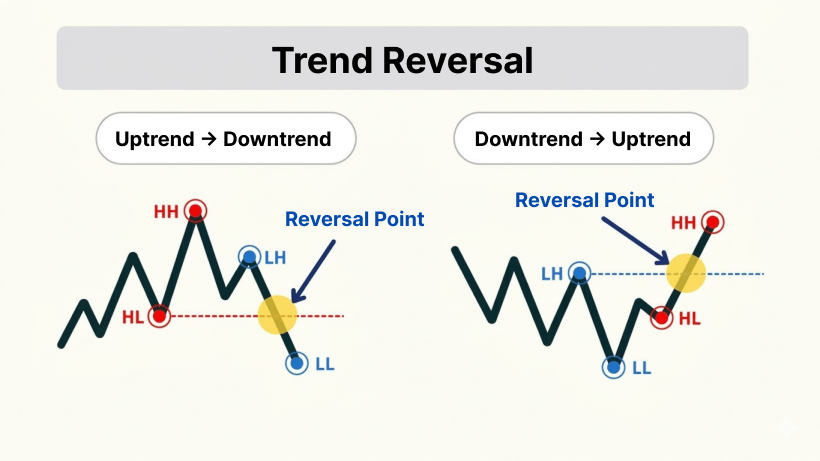
To determine whether a trend is continuing or reversing, observe breaks in the wave pattern. Typical reversal patterns include:
-
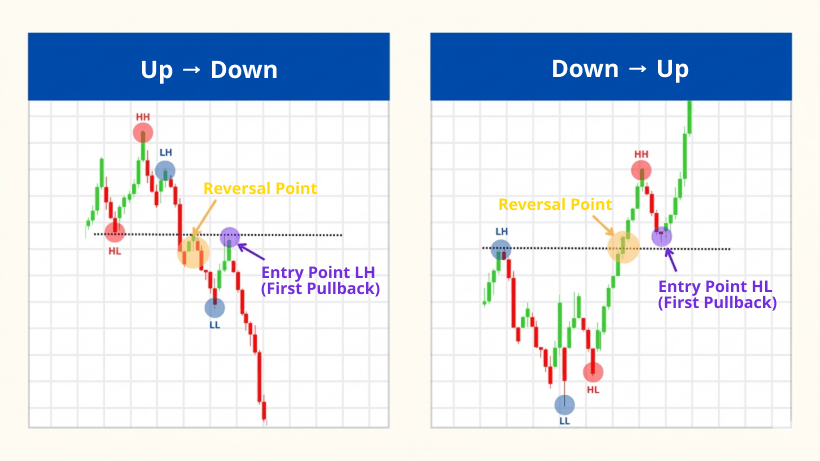
Uptrend → Downtrend:
1. Fails to surpass the recent high and drops below the previous high (LH appears)
2. Clearly breaks below the recent low (HL becomes LL) -
Downtrend → Uptrend:
1. Fails to break the recent low and rebounds above it (HL appears)
2. Breaks above the recent high (LH becomes HH)
It is important to note that confirming only highs or lows is insufficient; verification with both points (“2-point confirmation”) is necessary to avoid premature or incorrect judgments.
Practical Ways to Avoid Fakeouts with Dow Theory
Beginners often encounter “fakeouts,” e.g., when a resistance is temporarily breached but quickly reverses, triggering a stop-loss. To mitigate this, the following measures are effective:
-
1.
Wait for candlestick confirmation
Ensure the candle body has decisively broken the level; watch out for wicks that overshoot. -
2.
Check trends across multiple timeframes
Verify that signals on short-term charts align with longer-term trends (multi-timeframe analysis). -
3.
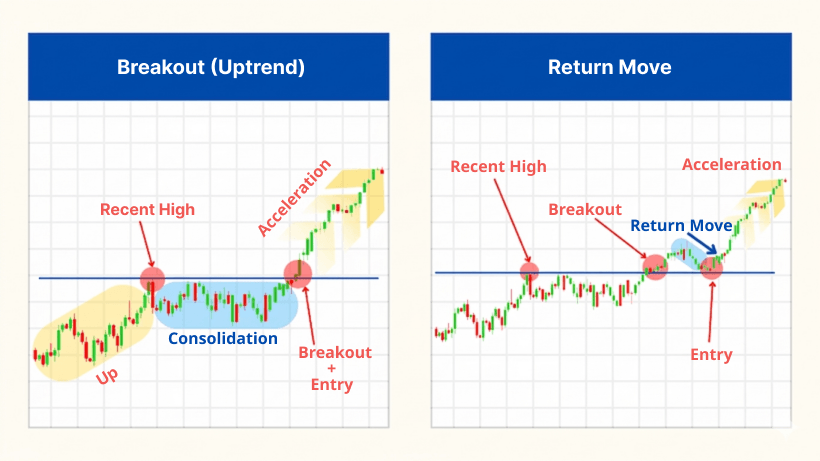
Wait for a return move
Observe a pullback to the broken line (roll reversal) and confirm the bounce before entering. -
4.
Use volume and other indicators for confirmation
Increased tick volume or supporting indicators such as MACD or RSI improve reliability.
By using confluence of multiple confirmations, the probability of being caught in a fakeout is significantly reduced. Recognizing higher highs and higher lows (or lower highs and lower lows) is the fundamental and most critical point when applying Dow Theory on charts.
Practical Dow Theory Rules for Entries, Take-Profit, and Stop-Loss

Riding the Trend: How to Identify Entry Points Using Dow Theory
The core principle of Dow Theory is “follow the trend”. In other words, the basic strategy is trend-following: go long in uptrends and short in downtrends.
For trend-following entries, there are three optimal timing opportunities:
-
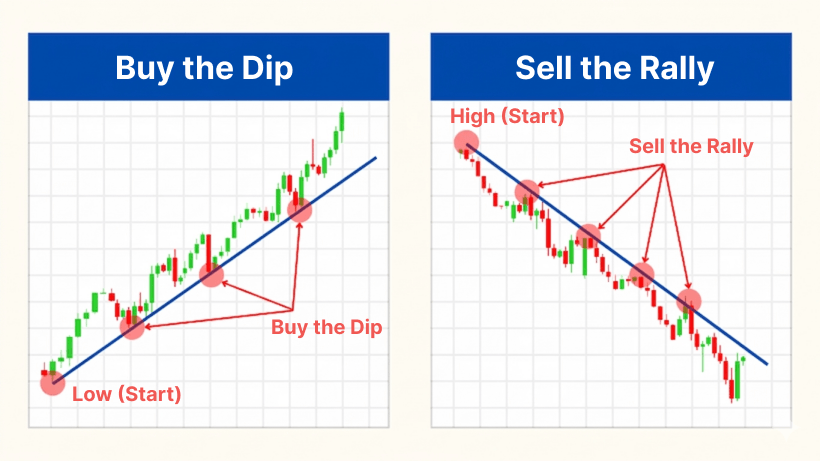
Buying on Dips / Selling on Pullbacks
In an uptrend, target temporary declines followed by a rebound (dips), or in a downtrend, target temporary rallies followed by a fall (pullbacks). This is one of the most stable trading approaches. When prices repeatedly bounce off a trendline, trend-following is more effective. Note that reversals rarely occur exactly on the trendline; they often happen just before or slightly beyond the line.
-
Breakouts / Breakdowns
These occur when prices break sharply out of a range, triangle, or other consolidation phase. While momentum can be captured, fakeout risks exist, so careful confirmation is necessary.
-
First Entry After Trend Reversal
Immediately after confirming a trend reversal—e.g., a pullback (HL) after a down-to-up reversal, or a retracement (LH) after an up-to-down reversal—these are high-confidence entry points.
For all these patterns, the key is to enter only after the high and low patterns are clearly confirmed. Avoid premature entries and always trade with solid reasoning.
Setting Stop-Loss and Take-Profit Levels: Risk-Reward Considerations
No strategy guarantees success in every trade. That’s why it’s essential to establish stop-loss and take-profit rules beforehand.
-
Stop-Loss Level
Set it at the point where the entry rationale is invalidated.
Example: For a long position, exit if the price drops below the recent HL (low). -
Take-Profit Level
Adjust flexibly based on market potential. Typical reference points include:
・Past support and resistance levels
・Fibonacci targets (61.8%, 161.8%, etc.)
・When trend momentum weakens (partial exit when reversal signals appear)
Additionally, always set a risk-reward ratio of 1:1.5 to 1:2 or higher before entering. This allows your account to grow even if your win rate falls below 50%.
Common Beginner Mistakes and How to Avoid Them
FX beginners often fall into predictable traps. Here are common examples and corresponding countermeasures:
| Mistake | Countermeasure |
|---|---|
| Unclear high/low judgment leading to premature entry | Wait for HL/LH confirmation and verify chart patterns before entering |
| Taking positions against the trend | Confirm long-term trend and prioritize strategies aligned with market direction |
| No stop-loss set or adjusted improperly | Always define stop-loss levels at entry and execute mechanically with fixed lots |
| Forcing trend-following in range-bound markets | Recognize sideways trends; wait for a breakout or switch to counter-trend strategies within the range |
For beginners, the most important practice is deciding entry, stop-loss, and take-profit levels before trading. Without this, understanding Dow Theory alone is not enough, and repeated mistakes are likely.
The next chapter discusses why Dow Theory alone may be insufficient and how combining it with other technical indicators can enhance practical trading skills.
Can You Trade Successfully with Dow Theory Alone? Limitations and How to Combine It with Other Methods

Limitations of Dow Theory and the Role of Confirming Indicators
Dow Theory is very useful for analyzing market flow and trend direction, but relying on it alone makes consistent profits difficult. The reason is that while it excels at identifying trends, it is weak in timing precision and setting price targets.
For example, you may know “it’s an uptrend, so buy,” but Dow Theory doesn’t tell you where to enter or where to take profit. It also cannot fully prevent fakeouts. Especially in range-bound markets or during sudden news events, relying solely on Dow Theory can lead to uncertainty in decision-making.
To overcome these limitations, it’s essential to use supporting indicators. Combining tools such as moving averages, MACD, and horizontal support/resistance lines can increase entry confidence and enhance resistance to fakeouts.
How to Improve Accuracy with Moving Averages, MACD, and Horizontal Levels
Here are supporting indicators that work particularly well with Dow Theory, and how to use them:
Moving Averages (MA)
-
A key tool for visualizing trend direction and strength.
-
When price is above the MA, it indicates an uptrend; below the MA indicates a downtrend.
-
After a trend reversal, checking whether the first pullback or retracement bounces off the MA can improve entry precision.
MACD
-
A momentum indicator that signals trend strength and potential reversals.
-
When Dow Theory suggests a potential reversal, a MACD golden cross or death cross can provide confirmation and increase reliability.
-
Divergence between price and MACD can also serve as a valid reversal signal.
Horizontal Lines (Support & Resistance)
-
Highs and lows identified with Dow Theory often correspond to key price levels, forming horizontal lines.
-
Drawing lines at points with repeated rebounds or reversals provides clear reference for take-profit, stop-loss, and breakout points.
The key is not to view these indicators in isolation, but to use them as supporting tools for timing and confirmation while keeping Dow Theory as the core. By creating multiple overlapping confirmations (confluence), decision-making for entries and take-profits becomes much clearer and more confident.
Summary: How to Turn Dow Theory into a Trading Edge

Improve Consistency Through Backtesting, Practice, and Clear Trading Rules
Dow Theory provides an excellent framework for understanding market direction and riding trends. However, merely understanding it as knowledge is not enough to trade profitably. What truly matters is how you apply it to your own trading.
The key process involves backtesting, practice, and rule-making.
-
1.
Backtest on Historical Charts
Examine how trend reversals and entry conditions actually appear in historical price movements.
-
2.
Practice with a Demo Account
Apply the rules identified during backtesting in a realistic chart environment to refine your feel for real trading conditions.
-
3.
Formalize and Standardize Your Rules
Translate criteria into explicit rules, e.g., “Buy on dips after HH/HL confirmation” or “Exit mechanically if entry rationale fails.” This ensures consistent trading decisions.
By repeating this process, your trading develops into a repeatable system, enabling decisions that are less influenced by emotions.
Start Small with One Currency Pair and the 1-Hour Chart
Beginners attempting multiple currency pairs or timeframes at once often become overwhelmed and indecisive. Start by focusing on one currency pair you frequently monitor (e.g., USD/JPY) and the 1-hour chart.
Gaining experience in a single environment helps you recognize trend habits and patterns.
From there, gradually adapt Dow Theory principles and trend analysis methods to your own style. Trading is not an overnight success, but consistent backtesting and accumulating rule-based experience is what builds a stable, profitable edge—keep this in mind.
Enjoyed this article? Share it with your network!
RYOEX Official Media is an information platform created specifically for traders, offering the latest news, analysis, guides, and more. From beginners to experienced traders, we provide useful content to help you stay informed and succeed in your trading endeavors.