


Oil Climbs as Hormuz Risk Outweighs a Large U.S. Crude Build

 August 18, 2026


Oil prices advanced in early Tuesday trade as renewed doubts about a U.S.-Iran settlement kept supply risk elevated. As of 01:24 UTC on August 18, publicly available delayed CME data showed September 2026 WTI futures at $84.88 a barrel. At 01:23 UTC, delayed ICE data placed October 2026 Brent futures at $91.09 a barrel.
The market is balancing two powerful but opposing signals: persistent threats to shipping through the Strait of Hormuz and Bab el-Mandeb, and evidence that some crude supply is reaching storage or being rerouted. The next decisive move is likely to depend less on diplomatic statements than on sustained vessel traffic, refinery operations and the pace of inventory change.
Crude Oil Market Overview
Geopolitical Risk Keeps the Front of the Curve Elevated
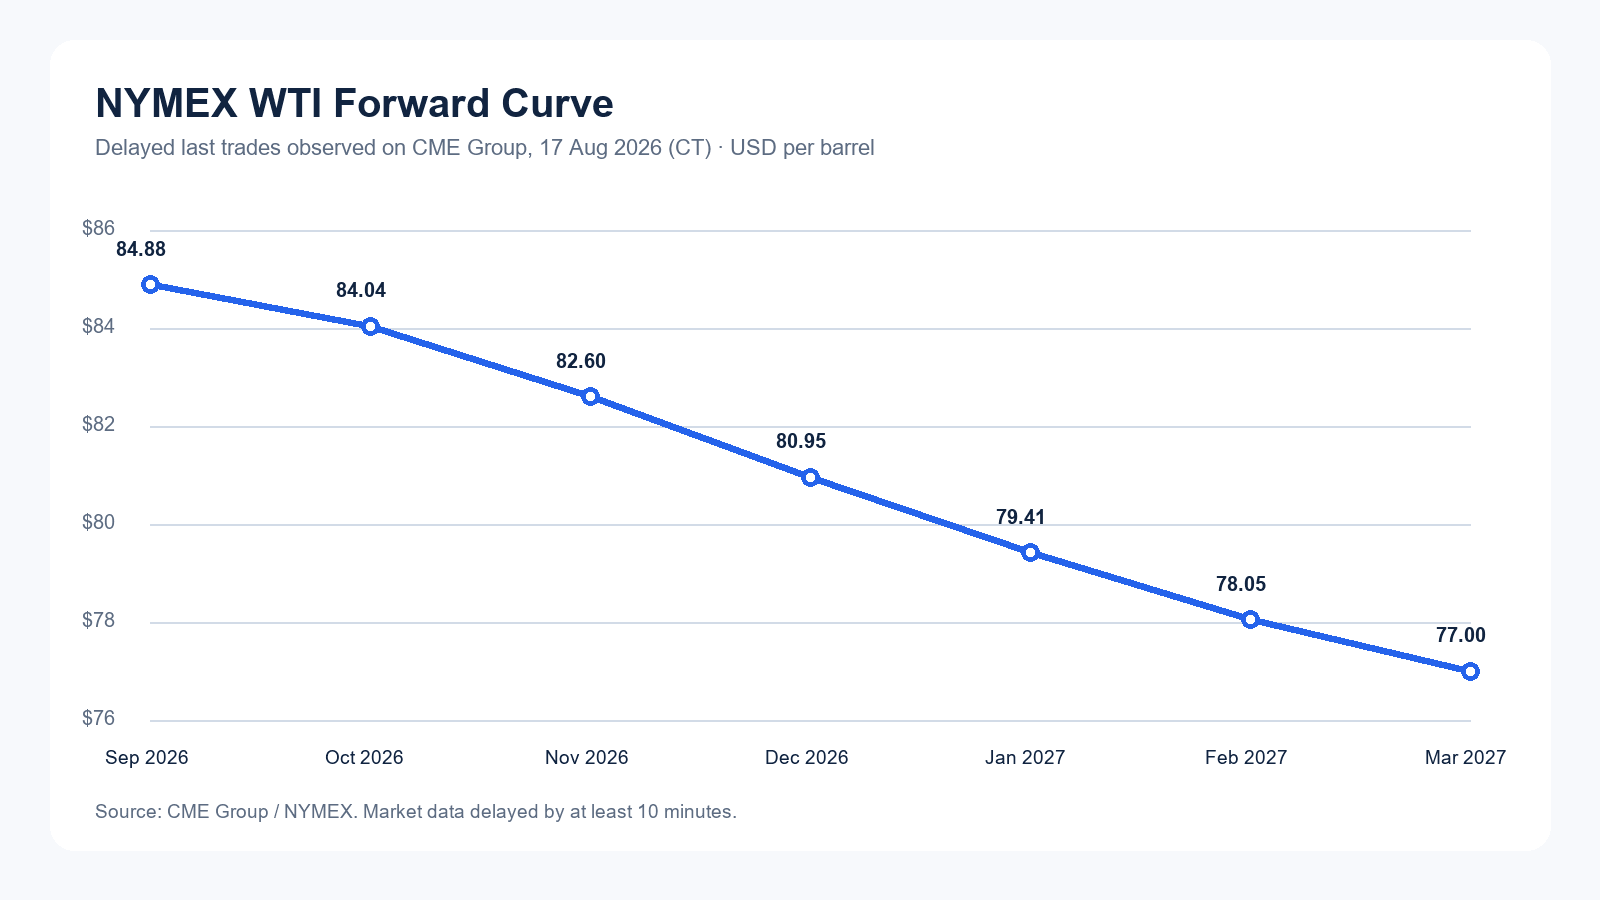
WTI and Brent were both trading higher during the Asian morning. The premium in nearby contracts was also visible along the NYMEX WTI curve: September 2026 stood at $84.88 a barrel, while March 2027 was at $77.00. That backwardation is consistent with a market placing more value on prompt barrels, although the curve alone cannot isolate the contribution from war risk, refinery demand or inventory policy.
The immediate geopolitical picture remained unsettled. The Associated Press reported on August 17 that Iran and Oman were working toward a transit arrangement for the Strait of Hormuz, while the U.S.-Iran negotiating period was expiring without an extension. The prospect of a route agreement offers a bearish path if commercial traffic normalizes, but threats surrounding the talks and recent attacks on vessels preserve a substantial upside risk premium.
A Large U.S. Crude Build Limits the Bullish Signal
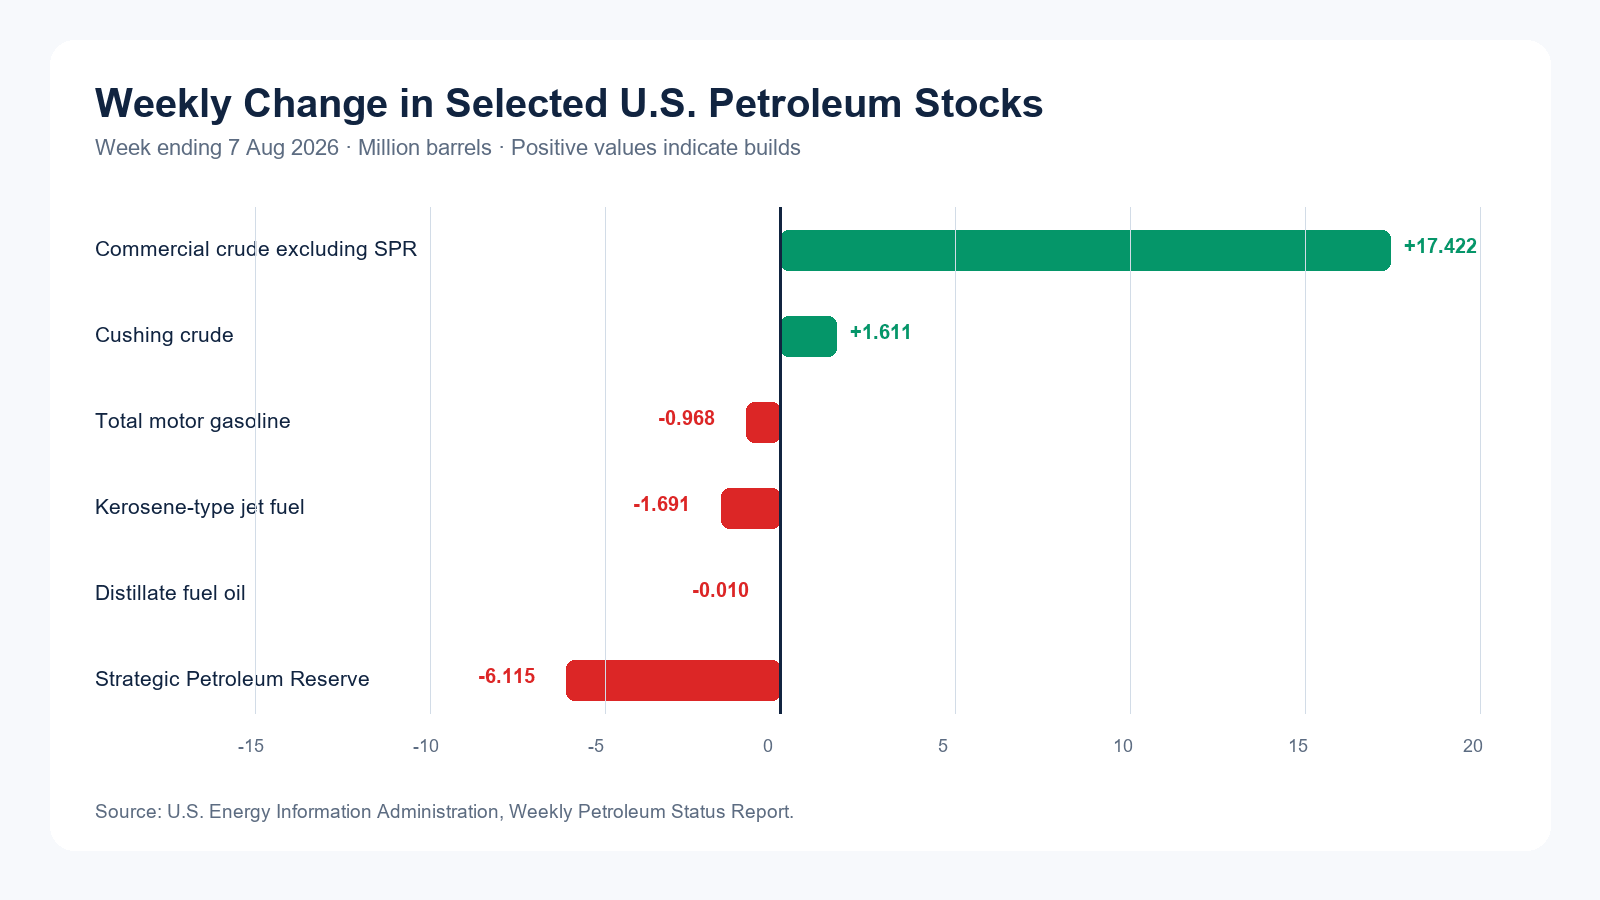
The latest U.S. Energy Information Administration data provide a counterweight to the rally. In the week ending August 7, U.S. commercial crude oil inventories excluding the Strategic Petroleum Reserve rose by 17.422 million barrels to 424.410 million barrels. Cushing stocks increased by 1.611 million barrels. Over the same week, the SPR fell by 6.115 million barrels to 298.694 million barrels, while gasoline and jet-fuel stocks declined.
This mix matters. The commercial build suggests that the U.S. system received a large near-term supply cushion, but the simultaneous draw from strategic stocks shows that part of the broader buffer is still being consumed. The EIA's next weekly release will clarify whether the commercial build was a one-week logistics effect or the start of a more durable inventory recovery.
Key Market Drivers and Analysis
Hormuz Remains the Market's Swing Variable
Analyst forecasts remain highly conditional on shipping. ING's July outlook projected Brent at an average of $80 a barrel in the third quarter and $74 in the fourth quarter, based on no further meaningful disruption through Hormuz. ING also set out a more severe scenario in which Brent could test $100 during the third quarter. Current prices above ING's base-case quarterly average show how quickly a renewed security premium can overwhelm a normalization assumption.
S&P Global Market Intelligence reached a similar but less bearish conclusion in its July forecast. It cut its 2026 Brent average to $87 a barrel from $103 after the interim U.S.-Iran understanding improved trade flows, while warning that renewed closure of the strait would restore shortage risk. Both ING and S&P therefore treat diplomacy and physical transit as the key conditions, not simply the headline status of a ceasefire.
Physical Supply Is Adapting, but Unevenly
Sparta Commodities reported in July that Asian markets had been relatively well supplied by a wave of Persian Gulf cargoes and that European and Asian refiners had become more comfortable with alternative supply origins. It also identified roughly 35 million barrels of awarded U.S. SPR crude still expected to move into private control by the end of August, a potential source of pressure on the front of the curve. Those observations help explain why prices have remained below the most extreme wartime peaks despite severe shipping risk.
That buffer is not unlimited. Long voyages, war-risk costs and refinery constraints make regional substitution slow and expensive. Europe may attract more Atlantic Basin swing barrels during autumn maintenance, while Asian refiners remain more exposed to the reliability of Gulf routes. Weak Chinese buying, highlighted by ING, is another bearish offset; a sustained recovery in Chinese refinery demand would tighten the balance more quickly.
OPEC+ Adds a Measured Policy Signal
On August 2, seven OPEC+ countries agreed to a 188,000-barrel-per-day production adjustment for September and reiterated their commitment to compensation for earlier overproduction. The policy change is modest beside the potential volume at risk from disrupted shipping, but it reinforces the point that producer policy and compliance remain important once transit conditions improve. Until then, effective exports and delivered supply matter more than nominal production targets.
Key Charts and Market Data
The NYMEX curve slopes downward from September 2026 through March 2027. This indicates stronger pricing for nearby supply, but it should be read as a composite of geopolitical risk, refinery economics and inventory conditions rather than as evidence of a single cause.
The latest EIA stock report shows the contrast between a large commercial crude build and continued draws from the SPR and selected products. That divergence helps explain why an apparently bearish headline inventory number has not displaced the geopolitical premium.
Market Outlook and Key Takeaways
Near-term support comes from restricted shipping, stalled diplomacy and the possibility that disruptions spread across both Hormuz and the Red Sea. The steep WTI curve and Brent above $90 are consistent with a market that still assigns substantial value to prompt availability.
The main downside risks are the large U.S. commercial crude build, continued rerouting of Middle Eastern barrels, weak Chinese buying and the prospect that a workable shipping agreement quickly releases trapped supply. The widest disagreement among analysts is therefore not about the importance of Hormuz, but about how fast commercial traffic and regional production can normalize.
The most useful signals to watch are verified vessel counts through the two chokepoints, the next EIA inventory report, evidence of refinery restarts and whether physical differentials confirm or reject the strength seen in futures. Until those indicators move together, crude prices are likely to remain volatile and unusually sensitive to security developments.
Sources and References
-
CME Group, Crude Oil Futures Quotes, delayed data observed August 18, 2026.
-
ICE Futures Europe, Brent Crude Futures Data, delayed data observed August 18, 2026.
-
U.S. Energy Information Administration, Weekly Petroleum Status Report, week ending August 7, 2026, released August 12, 2026.
-
Associated Press, Trump threatens Oman as it works with Iran on a Strait of Hormuz deal, August 17, 2026.
-
ING, Monthly Economic Update: July 2026, July 2026.
-
S&P Global Market Intelligence, Commodity Price Watch: July 2026, July 17, 2026.
-
Sparta Commodities, War kindles anew from the ashes of the MOU, July 20, 2026.
Enjoyed this article? Share it with your network!


RYOEX Official Media is an information platform created specifically for traders, offering the latest news, analysis, guides, and more. From beginners to experienced traders, we provide useful content to help you stay informed and succeed in your trading endeavors.


