


Crude Oil Weighs Hefty U.S. Stock Build Against Hormuz Supply Risk

 August 14, 2026


Crude oil entered Friday's Asian hours with a heavy U.S. inventory build pressing against persistent supply anxiety around the Strait of Hormuz. At 01:08 UTC on August 14, publicly available delayed exchange data showed September WTI at $81.34 per barrel and October Brent at $87.20 per barrel.
The balance is unusually two-sided. U.S. commercial crude stocks jumped as imports rose and exports fell, while four-week product demand softened year over year. Yet U.S. crude stocks remain below their seasonal five-year average, global inventories have been drawing, and constrained Middle Eastern flows continue to leave the market vulnerable to shipping and refined-product disruption.
Crude Oil Market Overview
| Benchmark | Active nearby contract | Delayed last | Quote time |
|---|---|---|---|
| WTI | September 2026 | $81.34/bbl | 01:08 UTC, Aug. 14 |
| Brent | October 2026 | $87.20/bbl | 01:08 UTC, Aug. 14 |
Both observations came from an active global electronic futures session. CME's WTI data were delayed by at least 10 minutes and ICE's Brent data by at least 15 minutes; they are reference prices, not real-time executable quotes.
U.S. Inventory Shock
The U.S. Energy Information Administration reported that commercial crude inventories excluding the Strategic Petroleum Reserve rose by 17.4 million barrels in the week ended August 7, reaching 424.4 million barrels. The increase reflected a sharp shift in trade flows: crude imports climbed by 1.140 million barrels per day to 7.339 million, while exports fell by 627,000 barrels per day to 3.058 million. Refinery inputs remained high at 17.179 million barrels per day and utilization reached 96.2%.
The headline build is a clear near-term drag, but the composition is less uniformly bearish than the size suggests. Commercial crude stocks were still about 2% below their five-year seasonal average. Gasoline inventories fell 1.0 million barrels and were 6% below average, while distillate stocks edged down and remained 12% below average. Four-week total products supplied averaged 20.720 million barrels per day, 2.1% below a year earlier, leaving soft aggregate demand alongside comparatively tight product buffers.
Key Market Drivers and Analysis
Global Supply Risk
The EIA's August outlook estimated that oil flows through the Strait of Hormuz averaged only 4.9 million barrels per day in the second quarter, down from 21.6 million in the fourth quarter of 2025. It also estimated a 4.2 million-barrel-per-day global inventory draw in the second quarter and forecast a further 3.8 million-barrel-per-day draw in the third. That combination explains why a large U.S. build can pressure the prompt market without erasing the geopolitical premium.
OPEC's August report adds a second tension. It lowered 2026 global oil-demand growth to 0.6 million barrels per day, while crude production by Declaration of Cooperation participants rose 1.42 million barrels per day in July to 37.66 million. At the same time, OECD commercial stocks fell by 26.4 million barrels in June to 2.729 billion barrels, still 66.5 million below the five-year average. More supply is returning, but the inventory cushion is not yet comfortable.
Regional and Product Signals
The regional picture remains uneven. OPEC reported that Japan's crude imports rebounded to 2.1 million barrels per day in June, close to their five-year average, while China imported 7.1 million and India 4.8 million barrels per day. In Europe, stronger Rotterdam refining margins met low diesel and gasoline inventories; Singapore margins also remained firm. Those product-market signals matter because refinery and shipping constraints can keep fuel prices supported even when crude balances loosen.
In the United States, the latest weekly data point in the opposite direction for aggregate consumption: four-week gasoline supplied was down 0.5% year over year, although distillate and jet-fuel supplied were up 1.9% and 3.8%, respectively. The split argues against treating one demand measure as a complete global signal.
Independent Market Views
ING's Warren Patterson and Ewa Manthey wrote on August 13 that the large U.S. inventory build was bearish, but warned that renewed disruption around Hormuz could stall the recovery in Gulf supply. Their view makes the near-term path conditional on whether shipping flows improve faster than visible inventories accumulate.
Capital Economics' Hamad Hussain argued on August 13 that gasoline and diesel had decoupled from crude because of constraints on Middle Eastern and Russian products. He expected restored flows to reduce prices materially from 2027 rather than trigger an immediate collapse, emphasizing the lag between reopening routes and rebuilding the product supply chain.
S&P Global Market Intelligence's July 17 outlook, authored by John Anton, KC Chang, Maxwell Clarke and Thomas McCartin, put average Brent at $87 per barrel in 2026 and $82 in 2027. The team saw scope for prices to approach $90 through the summer if conflict re-escalated or Hormuz disruption intensified, but also cited softer demand and a fragile ceasefire as constraints.
Key Charts and Market Data
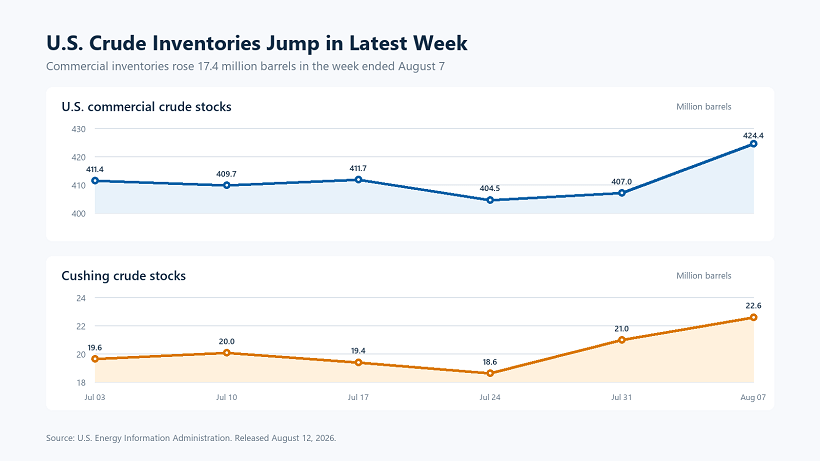
The EIA series shows that the August 7 increase broke sharply above the relatively narrow range seen through July. Cushing stocks also rose, but on a much smaller absolute scale. The move strengthens the near-term inventory overhang without resolving the broader question of whether constrained global flows will keep total stocks drawing.
Market Outlook and Key Takeaways
The immediate balance is between a visible U.S. crude surplus and a still-thin global buffer. The EIA's base case places Brent near $85 per barrel in the third quarter, then around $78 in the fourth quarter and $69 in 2027 as flows and supply normalize. That path is conditional: prolonged Hormuz disruption would preserve the supply premium, while sustained U.S. builds, weaker product demand and rising producer-group output would increase downward pressure.
The most informative near-term monitors are physical flows through Hormuz, the next EIA inventory release, U.S. gasoline and distillate stocks, refining margins in Europe and Asia, and crude-import trends in China, India and Japan. Together they will show whether the current U.S. build is a temporary trade-flow distortion or the start of a broader accumulation.
Sources and References
Enjoyed this article? Share it with your network!


RYOEX Official Media is an information platform created specifically for traders, offering the latest news, analysis, guides, and more. From beginners to experienced traders, we provide useful content to help you stay informed and succeed in your trading endeavors.


