


Oil Prices Rise as Hormuz Uncertainty Meets Mixed U.S. Inventory Signals

 August 11, 2026


Oil futures moved higher as renewed uncertainty over the timing of a sustained reopening of the Strait of Hormuz restored a geopolitical premium. As of 01:14 UTC on August 11, publicly available delayed CME data showed September 2026 WTI at $82.26 a barrel, while delayed ICE data put October 2026 Brent at $87.85 a barrel. Public quotes were delayed by at least 10 minutes on CME and 15 minutes on ICE.
The market is balancing an immediate risk to Gulf shipping against mixed fundamentals. U.S. commercial crude inventories increased in the latest weekly data, but gasoline and distillate stocks fell sharply and remained well below their five-year seasonal averages. Meanwhile, OPEC+ has approved a modest September supply increase, and medium-term demand forecasts remain cautious.
Crude Oil Market Overview
Transport Risk Returns to the Foreground
An Associated Press market report on August 10 described a roughly 5% rise in Brent as investors reassessed when shipping through the Strait of Hormuz could normalize. The exchange quotes observed later showed both benchmarks at elevated outright levels, although no comparable prior official settlement was available from the public quote tables used here.
The physical picture remains fragile. Kpler reported on July 31 that a rebound in Hormuz vessel crossings on July 28 and 29 faded the following day, leaving the durability of the recovery uncertain. That assessment predates the latest price advance, but it helps explain why prices remain highly responsive to new shipping headlines.
U.S. Inventories Send Conflicting Signals
The U.S. Energy Information Administration's report for the week ended July 31 showed commercial crude inventories excluding the Strategic Petroleum Reserve rising by 2.5 million barrels to 407.0 million barrels. Cushing stocks increased by 2.4 million barrels to 21.0 million. The crude build coincided with a 515,000-barrel-per-day rise in weekly imports and a 183,000-barrel-per-day decline in refinery inputs.
Products told a tighter story. Gasoline stocks fell by 1.6 million barrels to 209.7 million, about 7% below the five-year seasonal average, while distillate stocks dropped by 3.5 million barrels to 107.2 million, roughly 12% below that benchmark. Refinery utilization remained high at 96.5%. Four-week total products supplied averaged 20.4 million barrels per day, down 0.9% from a year earlier, while the gasoline and distillate components were modestly higher.
Key Market Drivers and Analysis
Shipping Normalization Is the Immediate Swing Factor
The central near-term question is whether higher vessel traffic can be sustained without another disruption. Kpler's flow analysis suggested that short-lived improvement is not the same as a durable return to normal operations. This distinction matters because the current risk premium is being driven primarily by confidence in the shipping corridor rather than by a single published production figure.
For Asian refiners, the same uncertainty affects both the availability and cost of crude. The International Energy Agency's July Oil Market Report noted reduced refinery activity in Asia as the conflict constrained supply. Kpler also identified China's participation as an important demand variable. For Europe, the transmission is most visible through Brent and refining costs, making the pace of Gulf flow normalization relevant well beyond the region.
Product Tightness Offsets the Crude Build
The latest U.S. data do not support a simple bearish inventory interpretation. More crude accumulated, especially at Cushing, but gasoline and distillate inventories declined from already low seasonal levels. High refinery utilization suggests that refiners were still processing substantial volumes even as weekly inputs eased.
This split can keep the crude market volatile. Continued product draws would support refining demand for crude, while another large commercial crude or Cushing build would strengthen the case that near-term supply is becoming easier outside the Gulf shipping constraint. The next EIA weekly release, scheduled for August 12, will provide the most immediate test.
Producer Supply and Demand Forecasts Pull in Opposite Directions
Seven OPEC+ participants approved a 188,000-barrel-per-day production adjustment for September and reiterated that countries which previously overproduced must complete compensation. The additional barrels are a modest bearish influence if delivered, but the monthly review process and compensation requirement leave actual supply outcomes dependent on compliance and regional operating conditions.
Demand projections are also cautious. The IEA's July outlook forecast world oil demand to contract by 1 million barrels per day in 2026 before growing by 2 million barrels per day in 2027. It estimated June supply at 98.8 million barrels per day, still 9.4 million below the pre-war level, and made its recovery path conditional on de-escalation.
ING's July base case placed Brent at $80 a barrel in the third quarter, $74 in the fourth quarter and $70 in 2027, assuming no further meaningful Hormuz disruption. Its more disruptive scenario allowed for a test of $100 in the third quarter. Those figures are scenario markers rather than current spot-price targets: they were published before the August 10 advance, and their value lies in showing how strongly the outlook depends on shipping and supply restoration.
Key Charts and Market Data
The latest EIA snapshot shows why the inventory signal is mixed. Commercial crude rose from the prior week, while gasoline and distillate stocks fell; all three categories remained below their comparable year-ago levels. The product declines are particularly important because they reduce the buffer available to absorb further supply or refining disruptions.
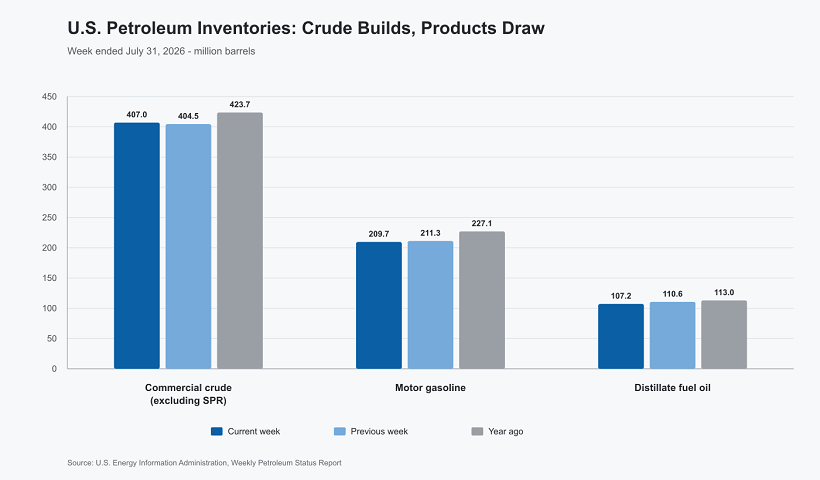
Source: U.S. Energy Information Administration, Weekly Petroleum Status Report, week ended July 31, 2026. Values are million barrels.
Market Outlook and Key Takeaways
Near-term price support rests on unresolved Hormuz shipping risk and tight U.S. product inventories. Those factors are partly offset by higher U.S. crude stocks, the planned OPEC+ September supply adjustment and institutional forecasts that anticipate weaker demand or greater supply availability if de-escalation holds.
The market's largest disagreement is therefore about timing: physical flows could normalize quickly enough to unwind the risk premium, or renewed disruption could keep Brent and WTI elevated even as underlying demand growth softens. The most useful next indicators are verified Strait transit data, the August 12 EIA inventory release, implementation of the OPEC+ adjustment and signs of renewed Chinese crude buying and Asian refinery activity.
Sources and References
-
CME Group, WTI Crude Oil Futures Quotes, delayed quote observed August 11, 2026.
-
ICE Futures Europe, Brent Crude Futures Data, delayed quote observed August 11, 2026.
-
U.S. Energy Information Administration, Weekly Petroleum Status Report, week ended July 31, 2026; released August 5, 2026.
-
OPEC, Seven Participating Countries Approve a September 2026 Production Adjustment, August 2, 2026.
-
Kpler, What the Strait of Hormuz's Fragile Recovery Signal Means for Oil Flows and Prices, July 31, 2026.
-
ING Think, Oil Off Its Highs, but Risks Return, July 9, 2026.
-
International Energy Agency, Oil Market Report — July 2026, July 10, 2026.
-
Associated Press, US Stocks Edge Down From Their Record After Oil Prices Climb 5%, August 10, 2026.
Enjoyed this article? Share it with your network!


RYOEX Official Media is an information platform created specifically for traders, offering the latest news, analysis, guides, and more. From beginners to experienced traders, we provide useful content to help you stay informed and succeed in your trading endeavors.


